[ TRAINING ] ♦ Personal training is an activity usually associated with fitness where a teacher is in charge of educating their clients by setting up an exercise program with specific goals. Teachers motivate them by creating a desire for training to improve their own condition.
The question of training concerns the physical body as well as the mind, which can be trained by using different learning programs. In the book Moonwalking With Einstein, Joshua Foer writes about how he was trained to attend the USA Memory Championships, a competition in which memory athletes retain as much information as possible during specific tests (Foer 2011). The speed card test, for instance, requires memory athletes to memorize the order of one shuffled deck of 52 playing cards as fast as possible. Such a challenge was the test that Foer had to become the winner of the USA Memory Championships of 2006.
[ PERSONAL REFLECTION ] ♦ Although education is a knowledge that teacher imparts ad personam — such in the case of Joshua Foer — personal training signifies also individual training. When knowledge does not pass through the oral method, apprentices need instruments to replace traditional teachers. A diary is one of them as it allows teacher and apprentice to coexist in the same person.
A diary is usually composed of personal records, such as thoughts and feelings expressed through intimate and private writings. Its author can look back at the records at a later time and reflect on their past in order to learn from mistakes. It provides an introspective reflection when read back.
One of the first diaries collecting private notes is titled Meditations (Marcus Aurelius 2006), and was written by the Roman emperor Marcus Aurelius (121–180 AD). Although historians cannot be completely sure about the originality of Marcus Aurelius’s text, two interpretations are possible to define the manuscript’s ambition: it is an original document that Marcus Aurelius wrote for personal and social development, or a later author identified as Marcus Aurelius wanted to educate their readers. Regardless of the possibility of various interpretations, the fact that the manuscript is an instrument for personal reflection is beyond any doubt (Kamtekar 2010wi).
[ DIGITAL TRACES ] ♦ What Marcus Aurelius left behind is an important historical record. Traces like his diary represent priceless opportunities to reconstruct culture, habits, and the social structure of the past. Yet writing down durable traces was rare for most people at that time, and these traces were often lost over centuries. Therefore, today we only have access to a small selection of them left (Kaplan and di Lenardo 2017). The book De Architectura, for instance, is the oldest architectural text that was preserved to the present day; it survived over two millennia. But its author, the Roman Vitruvius, is not the first person who wrote about architecture as he cites previous authors whose traces were ultimately lost (Cache 2018). The further we go back in time, the more difficult it is to find any kind of trace.
Moving from the past to the present changes our perception of time due to the density of traces. The closer we are to the present time, the more traces we have in terms of quantity and quality. This increase is particularly clear with the arrival of new technologies such as mobile phones, through which most of us produce tons of digital traces every day (Severo and Romele 2017) in a process that is called “datafication” (Van Dijck 2014) in which daily behaviors are translated into transmissible and storable computer information. Today humans delegate the production of inscriptions to machines (Latour and Woolgar 1986).
[ QUANTIFIED SELF ] ♦ If Marcus Aurelius and Vitruvius manually produced traces by themselves, today machines can produce digital traces for us. Traces that were manually recorded in the past can be automatically produced from human behaviors today. What is known as the quantified self, indeed, corresponds to the amount of information produced by devices from personal behaviors. If the traces of the past required a voluntary activity, today walks, calls, chats, email conversations, car journeys, money transfers, and train tickets are all automatically saved, and stored in data banks (Kaplan 2014). As Google has demonstrated by collecting books, emails, queries, paintings, etc. The ongoing capitalization of data is about collecting as many traces as possible, and these traces are all related to individuals.
[ DESIGN VISUALIZATIONS ] ♦ While the traces left by Marcus Aurelius are material and visible, digital traces need to be processed to be readable. Visibility results from a series of transformations, which produce a data visualization where alphanumeric data assume graphical appearance. Although some aspects of the original matter are lost during translation, new aspects of the matter are revealed (Latour 1995). This new form allows for grasping information that would not otherwise be accessible (Bertin 1981).
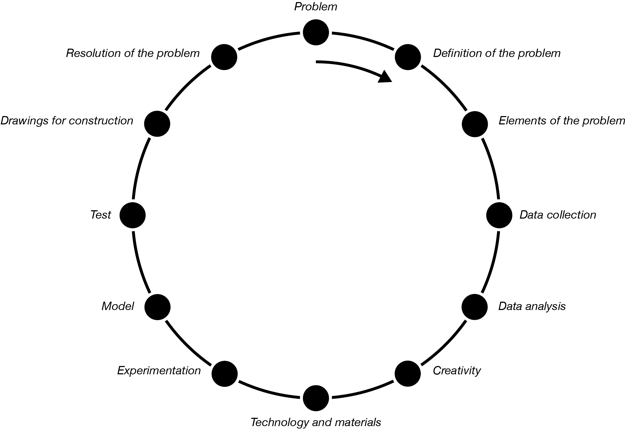
Visualizations are human artifacts that result from a design process that defines characteristics and means of production of an object, such as a car or a building. Visualizations are designed according to specific needs and defined contexts. Andrea Branzi defines the design process as an accurate development of creation (Branzi 2015) while Bruno Munari presents the steps that compose such a process (Munari 1983). Munari’s steps can be closed in a circular process that repeats itself and adapted to the design of visualizations (see Figure 1).
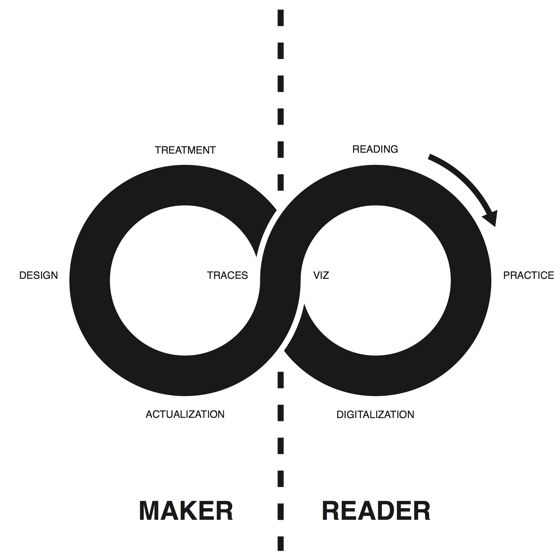
[ DESIGN CIRCULARITY ] ♦ Visualizations are the result of a series of translations that modify the form of original traces. The left side of Figure 2 illustrates this transformation in four steps: a) collect digital traces, b) clean, filter, and order traces to get data, c) project data using a visual grammar and d) actualize the visualization into a tangible object (Rodighiero 2018; Rodighiero and Romele 2020). Information that was not accessible is now readable through an optical instrument that makes visible what was invisible through standard means.
Iteration is an important feature of the design process; using Bruno Latour’s words, improving the form of an object means that “to design is always to redesign” (Latour 2008, 5). In particular, the circularity of visualization relies on two simple facts. First, visualizations are dynamic objects that can be continuously improved because the design process can be resumed at any moment. Second, visualizations are based on a continuous datafication, a fact that is particularly evident when digital traces form an unceasing flux of information, such as the nonstop geo-localization produced by mobile phones. As a result, visualizations may change in terms of form and content to such an extent that they might appear as living organisms reacting to their environment.
[ SELF-DESIGN ] ♦ Yet there is not only an iterative cycle of design concerning the development of visualization; there is also another crucial design process that affects humans. On a daily basis, individuals face different situations that help them to form a personal understanding of the world; this knowledge continuously changes through what is called education or experience. As visualizations are improved through cyclical design loops, human beings can likewise improve in an iterative way. Boris Groys calls this process of personal development self-design (Groys 2008; Axel et al. 2018).
Self-design is the iterative process of improvement that individuals apply to themselves. This development occurs through social interactions with other individuals who have different perceptions of the world, but it also occurs through nonhuman interactions with instruments that translate some aspects of the world in specific ways. The diary written by Marcus Aurelius is, for instance, an instrument employed to improve his own self.
Visualizations are objects that lend themselves to be used for personal training when individuals read information that relies on their own traces. The right side of Figure 2 illustrates the personal design process of someone looking at their own visual representation. Four steps compose the self-design iteration: a) the individual reads the visualization that has been produced from their personal digital traces, b) a careful reading modifies the individual’s knowledge and influences their actions in society, c) datafication transforms these daily practices and d) the result consists of the digital traces employed by the visualization to be updated. Even though the iteration is different, the design process can be equally applied to individuals as well as objects.
[ LEMNISCATE ] ♦ According to the fact that individuals design their own self when visualizations represent their individual practice, the cycle of design has a double length as it embraces both visualization and individual at the same time. Indeed, two cycles of design can coexist in the same loop forming the lemniscate symbol (Figure 2), which embodies the infinite mutual connectivity between individuals and their perception. The lemniscate features a point of intersection where visualization and digital traces are superimposed because they are the same thing, even if they have different shape. As previously written, the visualization is the outcome of a series of translations. The visual representation is nothing more than the actualization of personal practice, through which individuals can see their own self as if looking into a mirror.
The individual looking at their own self becomes their principal designer, their own personal trainer, and the one responsible for their improvement (Butler 2005). The design process pivots on a very strong connection that is established between reader and visualization through an act of self-recognition (Rodighiero and Cellard 2016). The reader and their representation are two sides of the same coin and this connectivity is fundamental for stimulating and motivating their personal development. As a result, visualizations might be instruments of personal development when representing personal digital traces. The individual looks at themselves in the past in order to modify their own present in such a way that it can be better than their own self from the past. The self-design implies a reflection on the past for projecting oneself into the future (Ricoeur 2005) and the individual becomes the demiurge of their own self as well as their best personal trainer.
Although motivation lies with the individual and not in the visualization itself, it is important to stress that individual and visualization must have confidence in each other. Datafication has to be credible to foster the design cycle and visualization has to display data in a fair and clear way. Only when this mutual trust occurs, can the individual take the visual instrument seriously, feeding it with new digital traces. Personal motivation, in a sense, is a mix of the confidence in the training instrument and the stimulus that individuals have to find in themselves. Machines per se are not auto-motivating instruments of design.
[ BIOLOGICAL PASSPORT ] ♦ Professional cyclists are athletes who push their physical performance to the limit. For them, visual instruments are useful for obtaining the best possible athletic performance. These instruments are based on data collected by thr athlete biological passport, which is mainly used to monitor the biomarkers of doping (Sottas at al. 2011). This passport is an excellent example of how individual can be digitally represented. Athletic practice is translated into digital traces that become readable through visualization. The athlete biological passport is based on the idea that each individual has only one document that will follow them all their life. The digital traces in the passport are personal and represent the athlete’s identity.
However, cyclists have more digital traces than these recorded in their athlete biological passport. Each cycling race, for instance, is translated into data as racers are monitored in real time: speed, power, and heartbeats correspond to the athlete’s quantified self (see figure 3). Looking at these data in real time, cyclists modify their performance in order to achieve their best.
Team Sky is one of the teams that makes the most use of datafication to improve the team’s performance (Medeiros 2016). Its cyclists are constantly monitored during training and performance. During the training they are monitored to improve their physical condition, and during the race they are monitored to get the best collective performance as cycling is a group sport (Fotheringham 2015). Team Sky’s athletes can see their performance in real time through visual instruments, which are produced by Garmin. The design process of the individual happens during training and races, but there is another design process that accompanies the development of technology and visual tools. The visual instrument designs the athlete and the athlete designs the tool with its feedback collected by engineers and designers.

[ COLLECTIVE DESIGN ] ♦ Although training and racing are moments of personal reflection, there is another moment that is noticeable because it is collective. Team Sky, for instance, gathers digital traces from group performance to organize a collective reading later (Rodighiero 2018). The team is asked to come together and evaluate the cycling race that has just taken place, resulting from the circulation of individual information among the cyclists (Rodighiero 2018). This collective reflection is a fundamental moment of design that does not single out each individual specifically, but rather it brings together the group into a collective process of self-design — the group is invited to reflect on the whole and not on the single elements. The aim of this exercise is to improve the group’s performance over the previous day; not surprisingly, Garmin’s slogan is “beat yesterday” (Garmin 2018).
[ CONCLUSION ] ♦ This article has focused on the design process that concerns individuals and collectives. Each of us, regardless of our level of preparation, can train ourselves using visualizations. This article has also focused on the relation that exists between individual and visualization, stressing the importance of belonging to a unique design process. The improvement is mutual as new skills require better visualizations and better visualizations bring individuals to higher levels of achievement. This mutual relationship is essential to understand their connectivity, which is called self-recognition.
Designers are invited to reflect on the individual as a project of design. Visualizations and individuals are intertwined as both can mutually improve iteration by iteration. The very core of design is shaping instruments as well as the individuals (McLuhan 1994).
The reciprocity of the self-design is probably one of the key concepts of the personal design, representing the new barrier to overcome in the near future. What are the characteristics of a designed object that improves with its user? How can an object transform itself every day so that it never becomes obsolete? What about a visualization that evolves autonomously as a human being? Is it possible to create a self-designing visualization?
_____
Bibliography
Axel, Nick, Beatriz Colomina, Nikolaus Hirsch, Anton Vidokle, and Mark Wigley. 2018. Superhumanity: Design of the Self. e-flux Architecture; University of Minnesota Press.
Bertin, Jacques. 1981. Graphics and Graphic Information-Processing. Walter de Gruyter.
Branzi, Andrea. 2015. Introduzione al design italiano: una modernità incompleta. Baldini & Castoldi.
Butler, Judith. 2005. Giving an Account of Oneself. Fordham University Press.
Cache, Bernard. 2018. “Vers une encyclopédie vitruvienne contemporaine.” Inaugural Lesson. EPFL. https://goo.gl/XhPPpR.
Foer, Joshua. 2011. Moonwalking with Einstein: the Art and Science of Remembering Everything. Penguin Press.
Fotheringham, William. 2015. “Team Sky Data Shows Chris Froome Tour Climb Was Exceptional but Normal.” The Guardian, July 21. https://www.theguardian.com/sport/2015/jul/21/team-sky-data-chris-froome-tour-de-france.
Garmin. 2018. “The Connected Bike.” Garmin Official Website. Accessed June 24. https://explore.garmin.com/en-US/cycling/.
Groys, Boris. 2008. “The Obligation to Self-Design.” e-Flux, no. 10 (November): 1–7. http://www.e-flux.com/journal/00/68457/the-obligation-to-self-design/.
Kamtekar, Rachana. 2010. “Marcus Aurelius.” Edited by Edward N. Zalta. The Stanford Encyclopedia of Philosophy. https://plato.stanford.edu/entries/marcus-aurelius/index.html.
“Le «Quantified Self» produit un nouveau discours autobiographique,” January 3. https://www.letemps.ch/node/41057/amphtml.
Kaplan, Frédéric, and Isabella di Lenardo. 2017. “Big Data of the Past.” Frontiers in Digital Humanities 4 (May). Frontiers: 769. doi:10.3389/fdigh.2017.00012.
Latour, Bruno, and Steve Woolgar. 1986. Laboratory Life. Princeton University Press.
Latour, Bruno. 1995. “The ‘Pedofil’ of Boa Vista: a Photo-Philosophical Montage.” Common Knowledge 4 (1): 144–87.
Latour, Bruno. 2008. “A Cautious Prometheus? a Few Steps Toward a Philosophy of Design (with Special Attention to Peter Sloterdijk).” In Networks of Design, edited by Fiona Hackney,
Jonathan Glynne, and Viv Minton. BrownWalker Press. https://goo.gl/rgQYRk.
Marcus Aurelius. 2006. Meditations. Penguin books.
McLuhan, Marshall. 1994. Understanding Media: the Extensions of Man. MIT Press.
Medeiros, João. 2016. “The Science Behind Chris Froome and Team Sky’s Tour De France Preparations.” Wired, June 30. http://www.wired.co.uk/article/tour-de-france-science-behind-team-sky.
Munari, Bruno. 1983. Da cosa nasce cosa: appunti per una metodologia progettuale. Laterza.
Ricoeur, Paul. 2005. The Course of Recognition. Translated by David Pellauer. Harvard University Press.
Rodighiero, Dario, and Loup Cellard. 2016. “Self-Recognition in Data Visualization: How People See Themselves in Social Visualizations.” https://infoscience.epfl.ch/record/218454/.
Rodighiero, Dario. 2018. “Printing Walkable Visualizations.” In Transimage Conference, 58–73. Edinburgh. doi:10.6084/m9.figshare.6104693.
Rodighiero, Dario, Frédéric Kaplan, and Boris Beaude. 2018. “Mapping Affinities in Academic Organizations.” Frontiers in Research Metrics and Analytics 3 (February). doi:10.3389/frma.2018.00004.
Rodighiero, Dario, and Alberto Romele. 2020. “The Hermeneutic Circle of Data Visualization: the Case Study of the Affinity Map.” Techné: Research in Philosophy and Technology 24 (2). Pre-print. https://infoscience.epfl.ch/record/263624.
Severo, Marta, and Alberto Romele, eds. 2017. Traces numériques et territoires. Presses de Mines. http://journals.openedition.org/netcom/1879.
Sottas, P E, N Robinson, O Rabin, and M Saugy. 2011. “The Athlete Biological Passport.” Clinical Chemistry 57 (7). Clinical Chemistry: 969–76. doi:10.1373/clinchem.2011.162271.
Team Sky. 2017. “Milan-San Remo Is Always a Mammoth Test. Take a Closer Look at @Kwiato’s Race Data Courtesy of @Whatstodaysplan #MSR ??.” Instagram. March 17. https://www.instagram.com/p/Bgb5gaognyE/?taken-by=teamsky.
Van Dijck, Jose. 2014. “Datafication, Dataism and Dataveillance: Big Data Between Scientific Paradigm and Ideology.” Surveillance & Society 12 (2): 197–208. doi:10.24908/ss.v12i2.4776.
Authors:
Dario Rodighiero, Massachusetts Institute of Technology (MIT)
Alexandre Rigal, École Polytechnique Fédérale de Lausanne (EPFL)
[ DARIO RODIGHIERO ]
Dario Rodighiero is a postdoctoral fellow at MIT and EPFL laboratories for digital humanities. The Swiss National Science Foundation is currently funding his position. He investigates the social dynamics making use of data visualization as well as the self-recognition that happens when individuals see themselves into visual representations. His research revolves around the design process that allows combining computer programming, humanities, and vector graphics.
[ ALEXANDRE RIGAL ]
Alexandre Rigal is research associate in the Laboratory of Urban Sociology at EPFL, where he obtained his PhD in sociology. His research deals with lifestyle changes and technologies of the self, mobilized by contemporary actors at individual and collective scale. He studies the places of invention of new lifestyles.